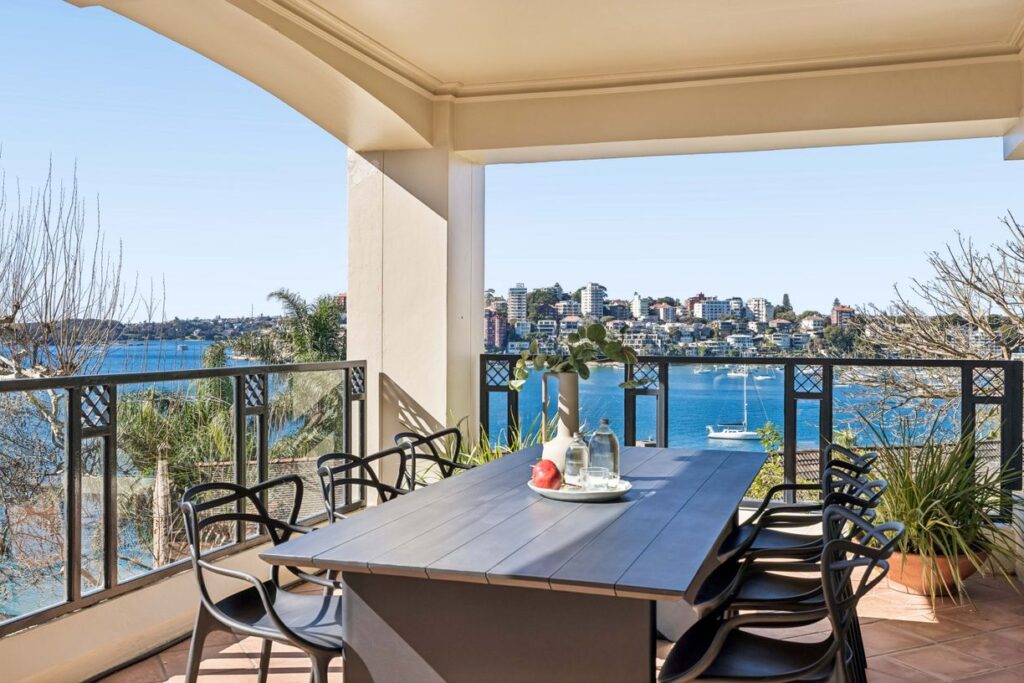
Suburb Report
One of Sydney's most tightly held pockets — houses traded just 8 times this year, at a median of $9.13m, with 111 homes changing hands in the last twelve months.
By Richard Faludi · Updated September 2026 · Data: Pricefinder
In the twelve months to September 2026, Darling Point recorded just 8 house sales at a median of $9.13m — a market defined by scarcity rather than turnover. The spread is wide: the highest recorded house sale reached $21.0m, while entry to the suburb — excluding outlier transfers — starts around $3.47m.
Apartments changed hands 103 times in the same period — 95 more transactions than houses, at a median of $2.65m. The median unit rent is $1,350 a week, putting gross yields at 2.6%.
At the 2021 Census the suburb was home to about 4,000 people; 87% of dwellings are apartments, and 35% of households rent.
Darling Point is the apartment capital of the harbour — tightly held buildings where the right aspect changes everything. Houses here are rarer still.
Median sale price, year by year. Toggle between houses and apartments — hover any point for the detail.
Calendar-year medians from recorded sales. The current year is shown to date.
102 sales were recorded here over the past twelve months. This is where they landed by price — and the months they sold.
173 rentals were recorded in Darling Point over the past year. Median weekly rents by bedroom count, tracked quarter by quarter.
Median advertised weekly rent per quarter, from recorded rental listings.
1 homes in Darling Point, sold by Richard himself — most recent first.
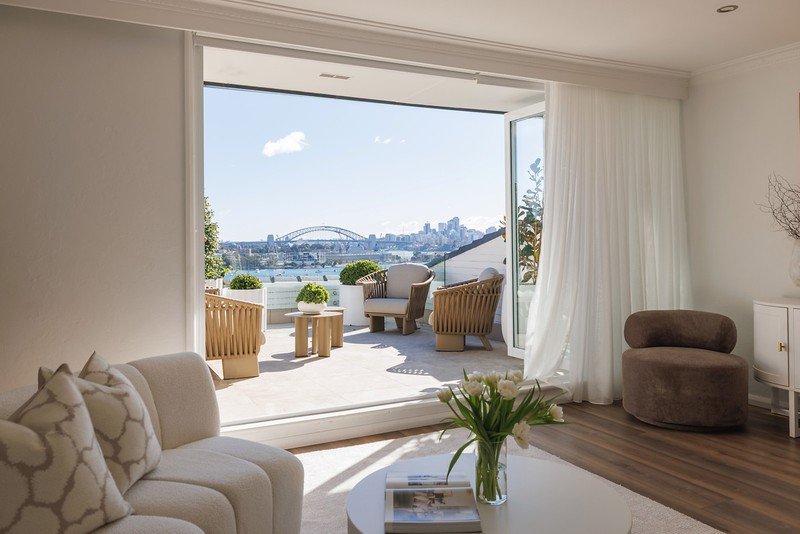 Sold $3.95m
9/38 Darling Point Rd
 Sold $1.45m
12/9 Goomerah Cres
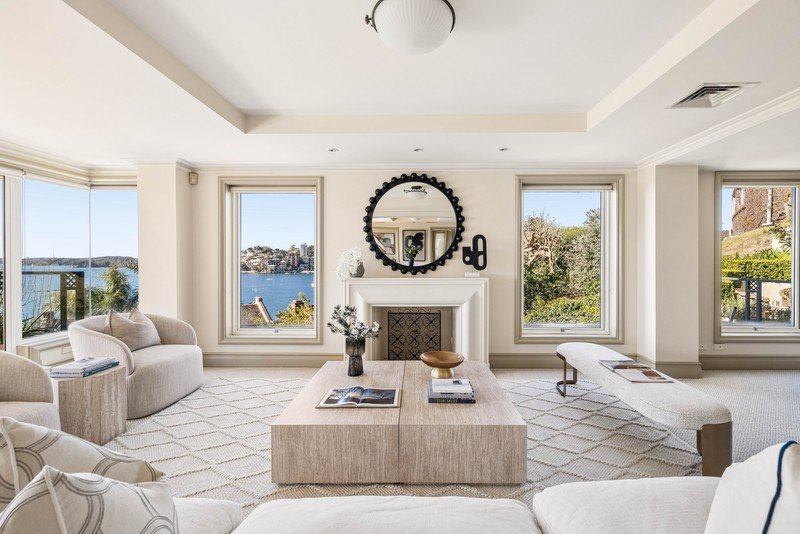 Sold $8.95m
3/8 Carthona Ave
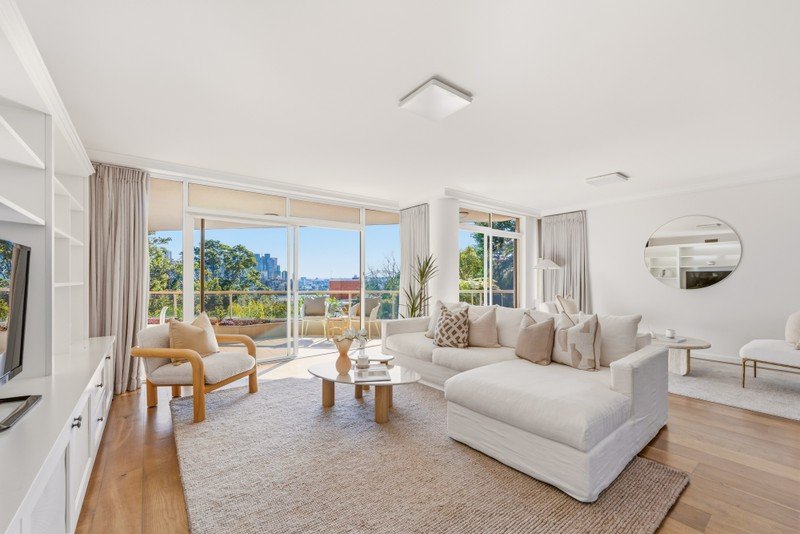 Sold $3.30m
2/95-97 Darling Point Rd
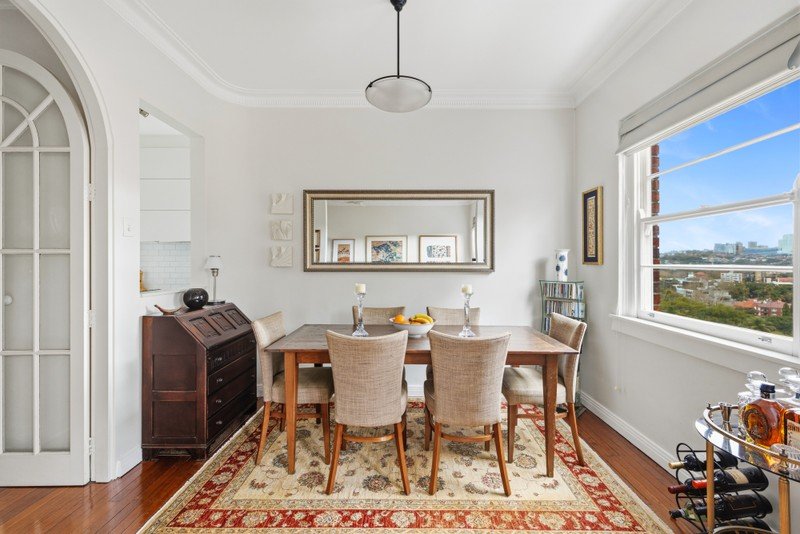 Sold $1.91m
7/2 Marathon Rd
 Sold $1.12m
6/65 Darling Point Rd
 Sold $2.75m
12g/3-17 Darling Point Rd
 Sold $12.2m
84 Darling Point Rd
Source: Pricefinder recorded sales. Some recent prices are agent-advised pending settlement.
Get an instant, data-backed estimate — then talk to the agent who knows the street.
Get your free estimate